When the Affordable Care Act (ACA) was passed in 2010, it made history as the most comprehensive overhaul the U.S. healthcare system had seen since the creation of the Centers for Medicare & Medicaid Services (CMS) in 1965. With the ACA, CMS laid out its Triple Aim of improving the patient care experience and the health of populations while reducing the per capita cost of healthcare. In 2012, CMS launched its flagship initiative to help accomplish these goals: the Accountable Care Organization (ACO), an alternative payment model designed to transition away from fee-for-service (FFS) programs towards value-based care.
By tying reimbursement to quality and efficacy rather than the quantity of care, Medicare Shared Savings Program (MSSP) Accountable Care Organization’s have generated more than $7 billion in savings to date. Despite these efforts, healthcare spending has continued to rise, leaving Medicare at risk of running out of money by 2024 — potentially sooner with the added expense of COVID-19. CMS has responded to these threats by more aggressively pushing Accountable Care Organization’s into downside risk while also bringing a new alternative payment model, the Direct Contracting Entity (DCE), to the market earlier this year.
Now more than ever before, Accountable Care Organization’s are under an enormous amount of pressure to maximize savings while improving quality of care, while also battling a global pandemic. With their first payment year starting in April 2021, DCEs also face a challenging road ahead. In order to help these organizations navigate the path forward, we will take a look in this article at how CMS measures performance via the practice of financial benchmarking with a focus on HCC capture and RAF accuracy. Understanding and applying these principles can mean the difference between generating savings or incurring losses, even when cost reduction has been maximized.
Putting the “Accountable” in Accountable Care
One of the biggest challenges in value-based care is figuring out how to measure the value. This is where benchmarking comes into play. Benchmarking is the primary means through which CMS holds Accountable Care Organization’s accountable and evaluates how effective they have been in lowering expenditures. To ensure Accountable Care Organization’s are not withholding needed services to generate savings, they must also meet certain quality measures. If an Accountable Care Organization spends less than the benchmark and meets its quality targets, it can share in the savings. If it fails to meet the benchmark, it may be responsible for repaying the federal government, depending on which type of risk track it’s on.
In addition to holding Accountable Care Organization’s accountable, benchmarking is also how CMS incentivizes participation in the program. For this reason, it must strike a careful balance in the way benchmarks are calculated. On the one hand, they must be stringent enough to ensure savings. On the other, they must be attractive enough for Accountable Care Organization’s to want to participate and fair enough to mitigate unintended consequences, such as penalizing those that serve sicker patients.
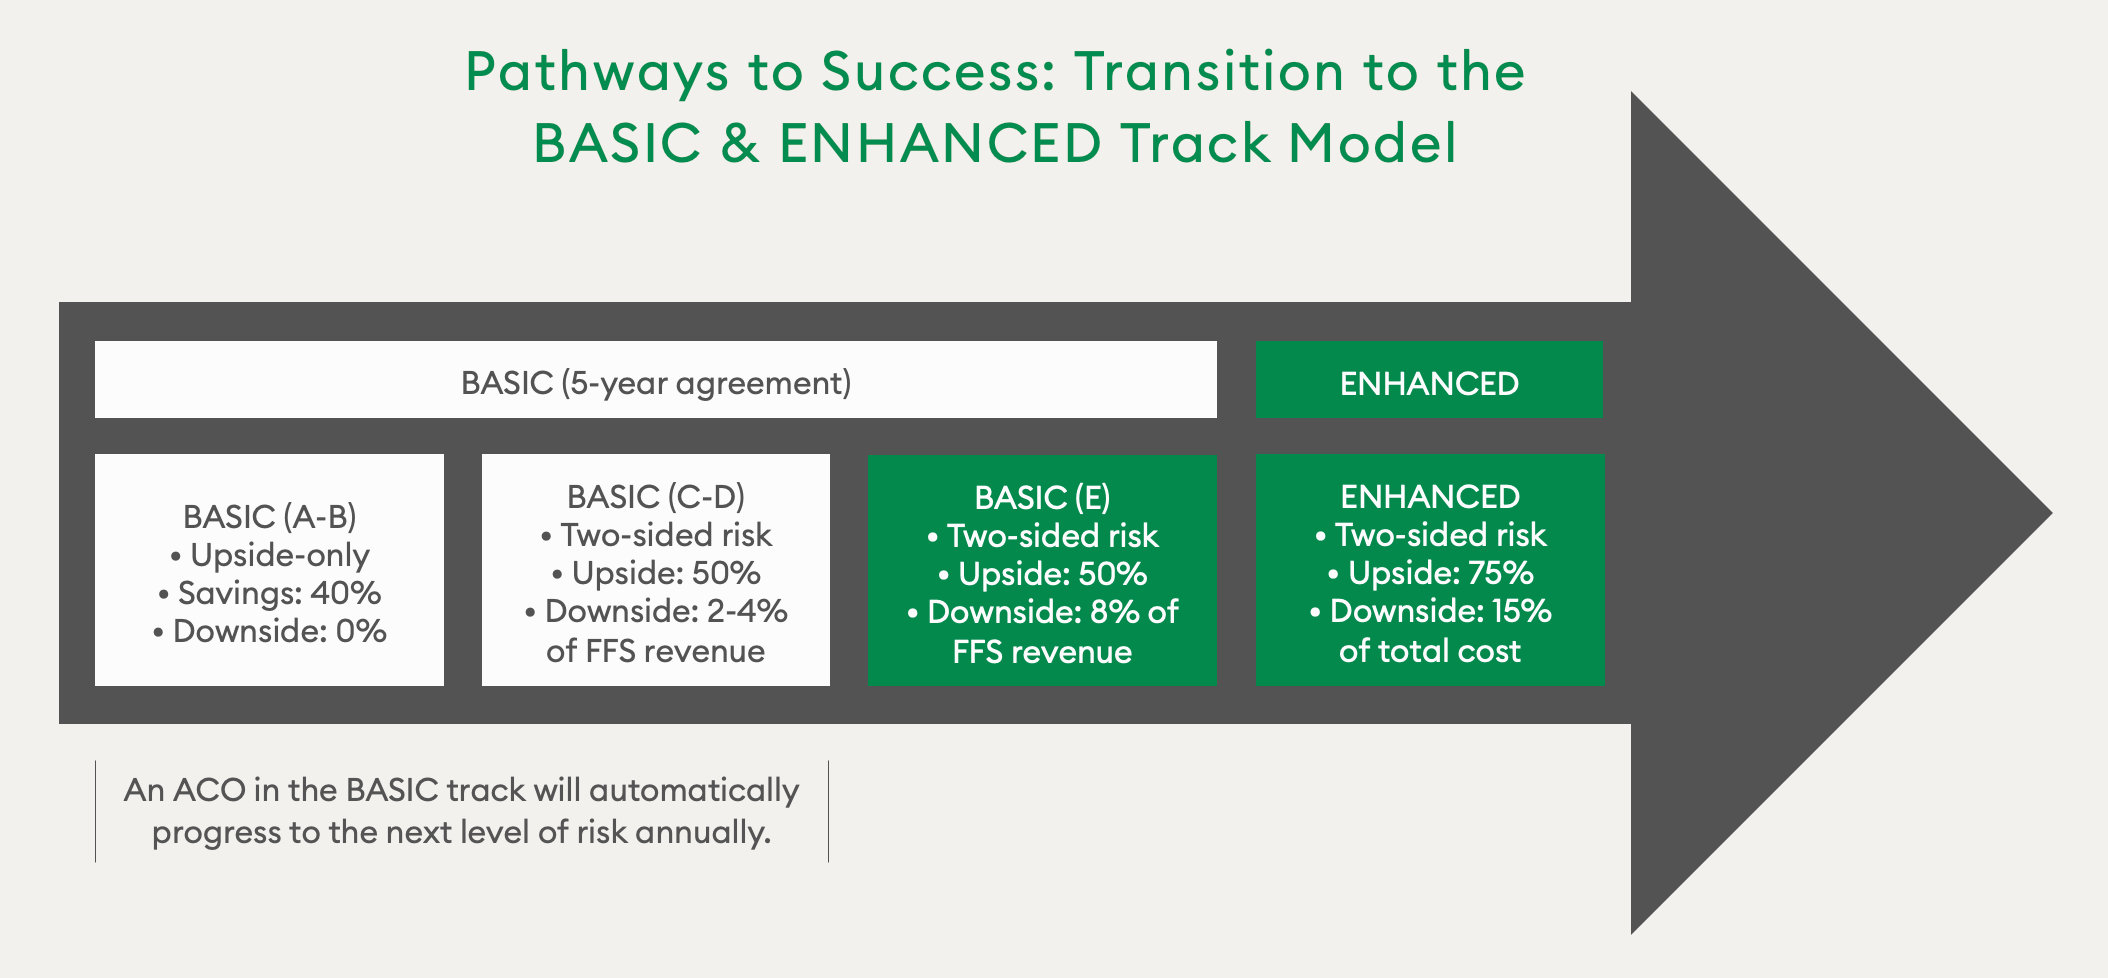
NAACOS, the largest association of Medicare ACOs, has been vocal in urging CMS to adjust aspects of the benchmark that hinder ACO growth and success. In response, CMS has updated its methodology multiple times, most notably by blending regional expenditure trends with historical data over the course of ACO agreement periods. In 2018, CMS overhauled the ACO program with Pathways to Success, accelerating the timeline for regional/historical blending as well as the pace for ACOs to take on downside risk. As part of this restructuring, CMS shortened the period ACOs are allowed to operate without downside risk from six years to a maximum of three, replacing the multiple track system with two tracks: BASIC and ENHANCED.

To mitigate the concerns of ACOs around assuming downside risk and help them navigate the COVID-19 pandemic, CMS has allowed ACOs to stay in the same risk arrangement in 2021.
Accountable Care Organization Shared Savings Example
The shared savings rate is the percentage of estimated savings (compared against the benchmark) that is paid to an Accountable Care Organization. For example, take an Accountable Care Organization on Track D (BASIC Track) with an annual benchmark of $15 million and a minimum savings rate of 2%. In 2019, the ACO outperformed the benchmark, saving 4% ($600,000), while hitting an average of 80% on its final quality score. To determine the ACO’s total shared savings, we must first calculate its final sharing rate. This is done by multiplying the final quality score by the max sharing rate, which is 50% for a Track D Accountable Care Organization. We then multiply that number by the amount the Accountable Care Organization saved in 2019:
80% quality score x 50% max sharing rate = 40% final sharing rate.
40% final sharing rate x $600,000 ACO savings = $240,000 total shared savings.
In 2019, 541 MSSP ACOs generated $1.19 billion in total net savings. This represents the program’s largest annual savings to date — and the third year in a row it has achieved net program savings. Overall, Pathways to Success ACOs saved ~37% more than legacy ACOs, generating net per beneficiary savings of $169 per beneficiary. However, both legacy and Pathways to Success ACOs achieved greater savings when taking downside risk, generating net per beneficiary savings of $152 per beneficiary, or ~30% more than those that took on no downside risk. In addition, ACOs with more experience continued to achieve greater savings, but new entrant ACOs achieved lower spending relative to their benchmarks in their first performance year for the first time.
How Benchmarks are Calculated
Every ACO’s benchmark is unique and determined by multiple factors, including historical expenditures and regional factors, as mentioned above, as well as patient population, which is measured via hierarchical condition category (HCC) codes. Before we dive into HCC coding, let’s first discuss how historical expenditures are calculated. Preceding the start of an Accountable Care Organization contract, benchmarks are established based on a risk-adjusted, weighted average of Medicare Parts A and B spending for attributed beneficiaries over a three-year period.
Historical baseline expenditure is calculated as follows:
- Most recent year = 60% weighted
- Second most recent year = 30% weighted
- Least recent year = 10% weighted
The historical baseline is combined with the regional cost adjustment, which is capped at a 5% increase or decrease of expenditures.
Turning HCCs into Risk Scores
To estimate future spending for a given population, CMS uses patient diagnosis history, which is mapped to HCC codes, to create a Risk Adjustment Factor (RAF) score. HCCs focus on chronic conditions that affect long-term health expenditures. They are referred to as hierarchical because some diseases have multiple codes that capture different levels of severity. For each disease, patients are assigned only the code corresponding to the most severe manifestation. Medical conditions must be documented and reestablished every year. Otherwise, they will not be incorporated into CMS’ annual risk score recalculations.
For example, take a newly attributed 67-year-old female who has diabetes without complications, or HCC 19. In year one, she develops a diabetic mono-neuropathy, which her provider documents via HCC 18: diabetes with chronic complications. In year two, however, her provider inaccurately documents HCC 19 rather than HCC 18. As a result, her year-two risk score will not reflect the increase in predicted expenditure associated with the increase in disease severity. Not only could a mistake like this result in reduced reimbursement, it may ultimately prevent the Accountable Care Organization from meeting its benchmark.
Risk Adjustment for ACOs
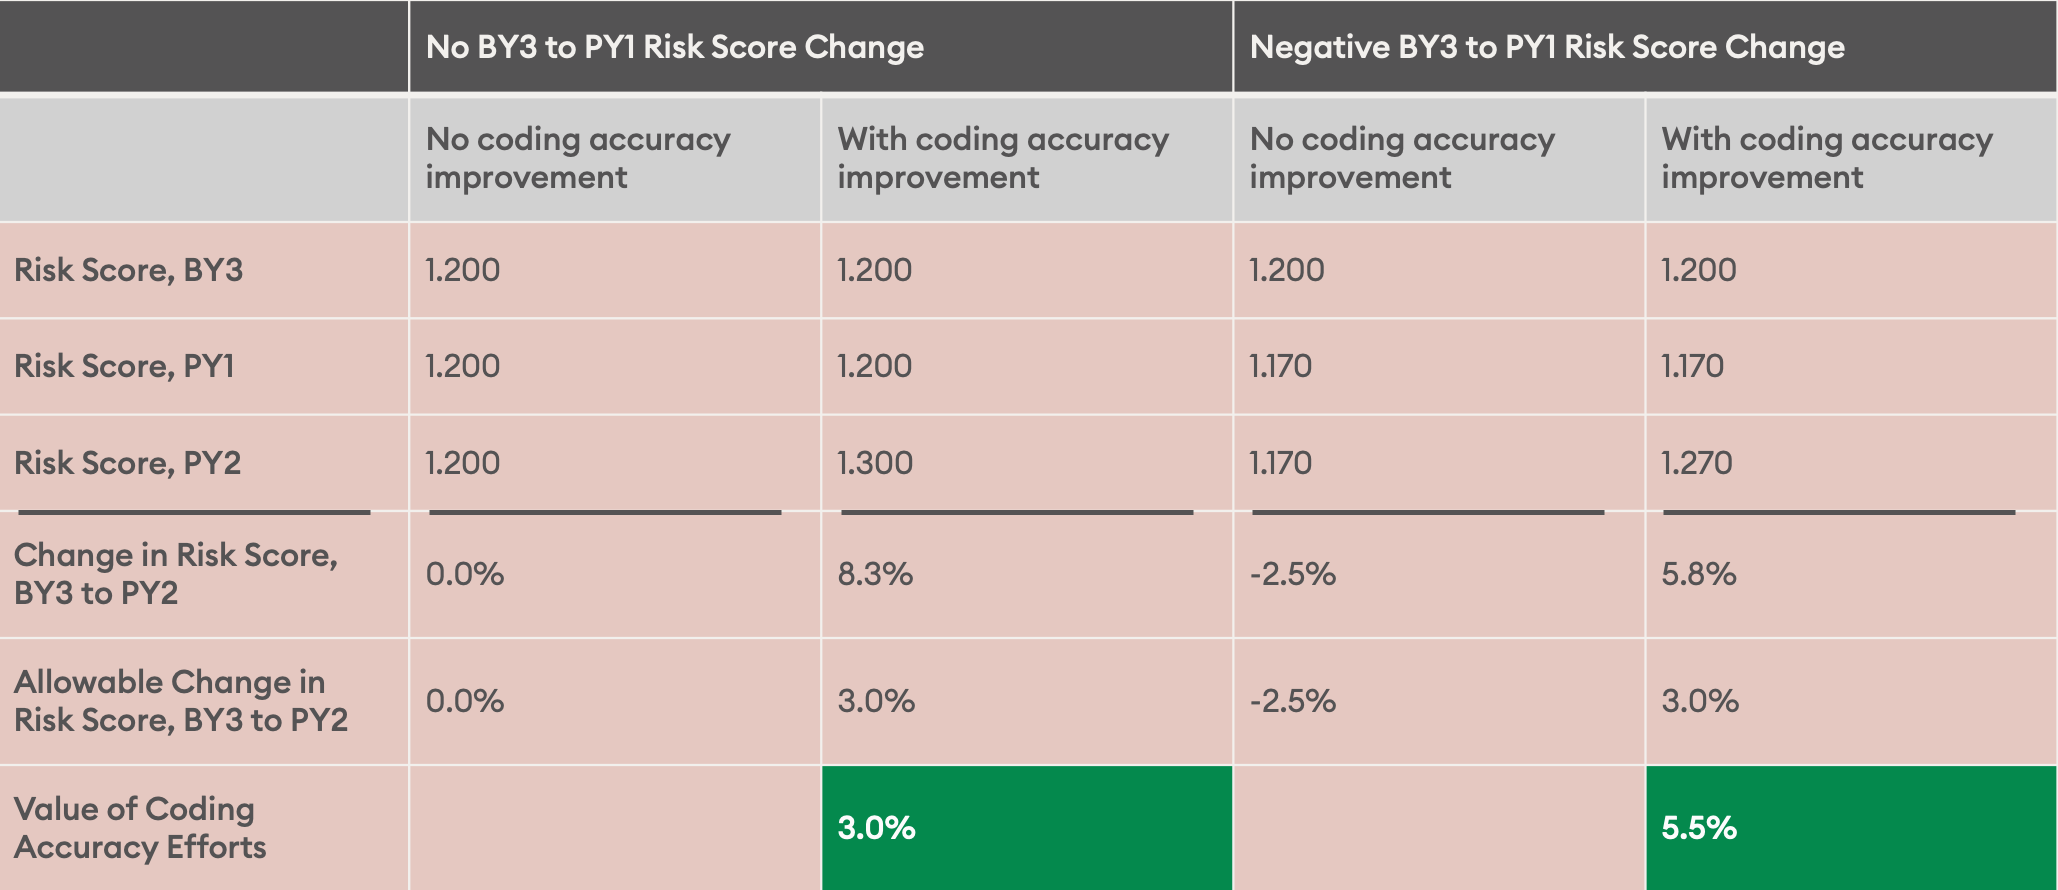
Medicare Advantage plans have been in the market twice as long as ACOs and are therefore more attuned to the implications of risk adjustment to their success. When the MSSP program was first starting out, ACOs were not as focused on risk adjustment. However, this has changed in recent years as CMS has updated its benchmarking policy, such as with Pathways to Success, which capped overall risk score increases at 3%. With this cap, documentation and coding may be the difference between shared savings and losses for many ACOs.

Risk adjustment has also become increasingly important as more and more ACOs are forced to assume downside risk while continuing to battle the pandemic. This is a tall order for any organization to navigate, but ACOs do not have to do it alone. Leveraging a partner to help identify missing HCCs, close gaps, and better manage care for patients — both retrospectively and prospectively — will be key. A comprehensive risk-adjustment program should include gap letters, patient outreach and scheduling, provider education, and concurrent review and retrospective programs. All of these initiatives should be powered by strong analytics to understand the prevalence of HCCs and opportunities to code better.
To learn more about our risk adjustment solutions, visit our homepage.

